
Elo Ratings in Soccer: How They Work
By Eren Şimşir · Published:
League tables tell you what has happened. A rating tells you how strong a team probably is, which is what you need to predict the next match. Elo ratings in soccer are one of the simplest and most widely used ways to get that number, and they sit at the start of the prediction model we describe on our methodology page. This guide explains how they work in plain terms.
Where Elo comes from
Arpad Elo designed the system to rank chess players. Each player has a rating; when two players meet, the rating gap predicts the result, and the real result then nudges both ratings. The same logic works for soccer clubs and national teams, with a few adjustments for draws, home advantage and goal margin.
The core formula
For two teams, A and B, the expected score for A is:
E(A) = 1 / (1 + 10^((R(B) - R(A)) / 400))
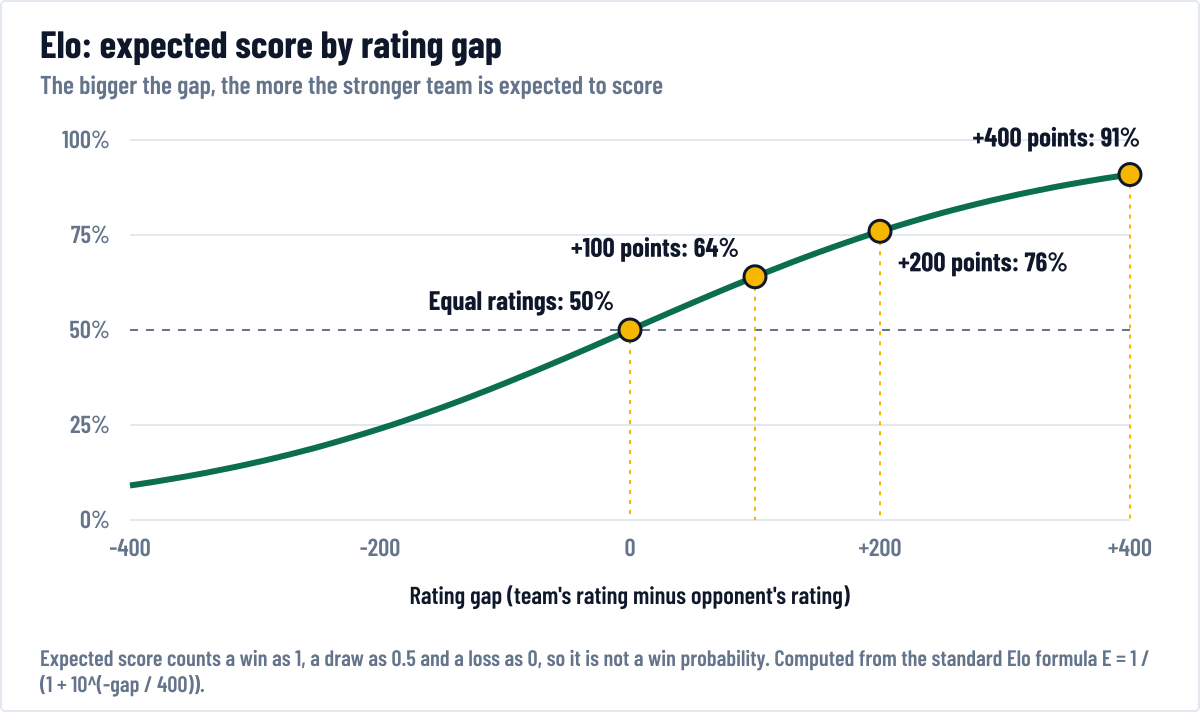
Here R is a team’s rating. A win counts as 1, a draw as 0.5 and a loss as 0, so “expected score” is the average result you would expect over many matches, not a win probability. Some quick reference points:
| Rating gap | Expected score for the stronger team |
|---|---|
| 0 | 50% |
| 100 | 64% |
| 200 | 76% |
| 400 | 91% |
How a rating changes after a match
After the game, each team’s rating moves by:
new rating = old rating + K × (actual result - expected result)
Suppose a team rated 100 points above its opponent is expected to score 0.64. If it wins, it scores 1, so it gains K × 0.36. If it loses, it scores 0 and drops K × 0.64. An upset therefore moves both ratings much more than a routine win. The two changes are equal and opposite, so the total rating in the system stays constant.
A worked example
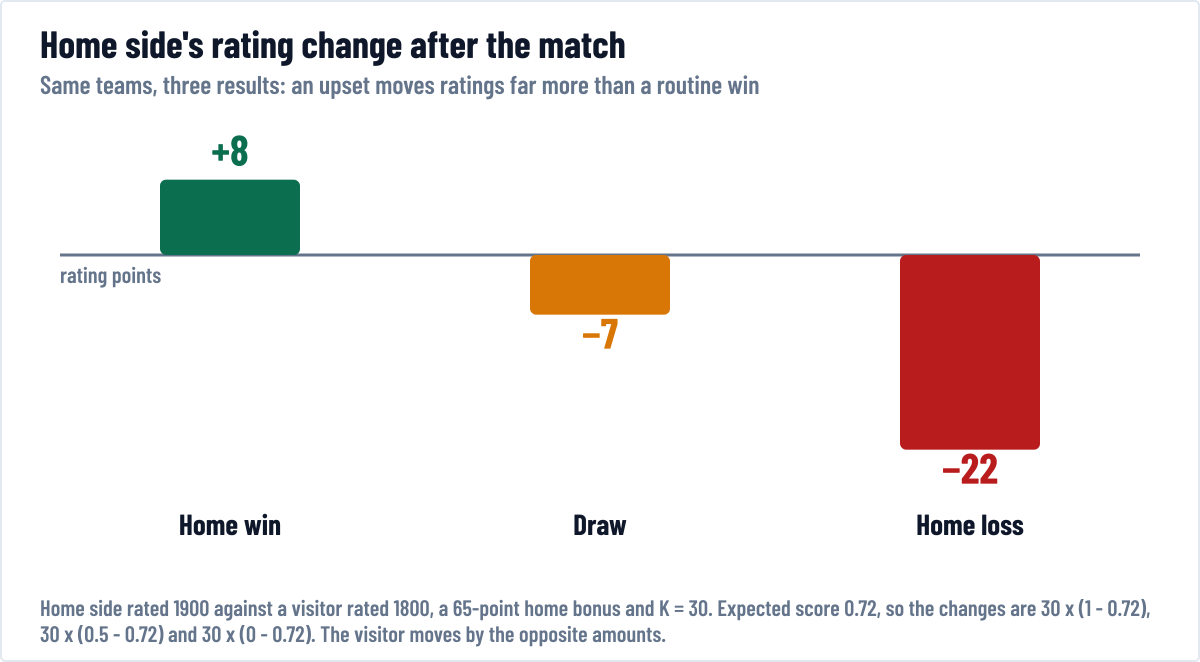
Take a home side rated 1900 against a visitor rated 1800, with a 65-point home bonus and K set to 30. The effective gap is 1900 + 65 - 1800 = 165 points, so the home side’s expected score is 0.72. Now see what each result does to the home team’s rating:
- Home win: it scores 1, so it gains 30 × (1 - 0.72), about 8 points.
- Draw: it scores 0.5, so it loses 30 × (0.72 - 0.5), about 7 points.
- Home loss: it scores 0, so it loses 30 × 0.72, about 22 points.
The visitor’s rating moves by the same amount in the opposite direction. Notice that a draw already counts as a small setback for the favourite. That is the system doing its job: the favourite was expected to do better than a draw.
The K-factor
K is the speed dial. A big K, such as 40 or 60, makes ratings respond quickly, which helps to track a team on a hot streak but also lets a lucky result distort the number. A small K, such as 20, produces stable ratings that react slowly. Systems often set K higher for important competitions than for friendlies.
Adjustments soccer needs
Chess has no home field and rarely ends in a thrashing, so soccer versions add two things:
- Home advantage. The home team receives a bonus, commonly in the range of 60 to 100 points, added to its rating only when calculating the expectation. Our model uses 65. We look at how large the effect really is in our guide to home advantage in soccer.
- Goal difference. Some systems scale K upward for larger margins, so a 4-0 win moves ratings more than a 1-0 win.
Why Elo is useful for predictions
Elo has three big strengths. It needs only results, so it works for any league or country. It accounts for opponent strength automatically. And it updates continuously, so it reflects a change in form or a new manager without waiting for a league table to catch up.
To turn ratings into a scoreline, a model converts the gap into expected goals for each team, then uses a Poisson distribution to calculate the chance of every scoreline.
Choosing a starting rating
Every team needs a number on day one. Common choices are to give all teams the same value, such as 1500, and let results sort them out, or to seed ratings from the previous season. The second option converges faster. Promoted clubs are often seeded slightly below the league average, and new ratings should be allowed to move quickly in the first dozen matches by using a temporarily larger K. Ratings need a long run of data before they are trustworthy, which is why we avoid reading too much into a team’s Elo in the first weeks of a season.
Where Elo falls short
- It does not know who is playing. Ratings do not change when a star player is injured until results begin to suffer.
- Promoted and new teams start from guesses. It takes several matches before the number settles.
- Different leagues are hard to compare. Unless clubs play each other often, a rating of 1800 in one country may not equal 1800 in another.
- It ignores how the result happened. A lucky win counts the same as a dominant one unless goal margins or chance quality are added.
For these reasons Elo is a starting point, not the whole story. Our model does not read injuries or chance quality, so those belong in the written analysis; our guide to expected goals covers the chance-quality side.
Using ratings yourself
If you want to see Elo in action, public sites such as ClubElo publish up-to-date club ratings you can compare with the league table. Look for clubs whose rating is far above or below their position: they are often the teams the table is about to correct.
Sources
- World Football Elo Ratings, “About”, eloratings.net. The Elo adaptation used for national teams, including the goal-margin multiplier.
- Hvattum and Arntzen (2010), “Using ELO ratings for match result prediction in association football”, International Journal of Forecasting. Evidence on how well Elo ratings predict football results.
- Elo rating system, Wikipedia, Wikipedia. The expected-score formula and the origin of the method in chess; the source book is Arpad Elo, The Rating of Chessplayers, Past and Present (1978).
Frequently asked questions
What does a 100-point Elo gap mean in soccer?
It gives the stronger side an expected score of about 64%, where a win counts as 1, a draw as 0.5 and a loss as 0. It is not a 64% chance of winning.
Who invented the Elo rating system?
Arpad Elo, a Hungarian-American physics professor, created it for chess in the 1960s. It was later adapted for soccer, most visibly in the World Soccer Elo Ratings.
What is the K-factor?
K controls how much a single result moves a rating. A higher K reacts faster to new results but is noisier, so competitive matches usually use a larger K than friendlies.
Is Elo better than league position for judging teams?
Usually, yes. Elo accounts for opponent strength and updates every match, while league tables mix different schedules and are slow to reflect changes in form.